 NTSC RS170A Timing from
manual for
NewTek
Calibar, a compact video signal generator.
NTSC RS170A Timing from
manual for
NewTek
Calibar, a compact video signal generator.
One user contributed these measurements of Video Bandwidth of TRV900 compared to BetaSP and some other devices.
NTSC RS170A Timing from
manual for
NewTek
Calibar, a compact video signal generator.
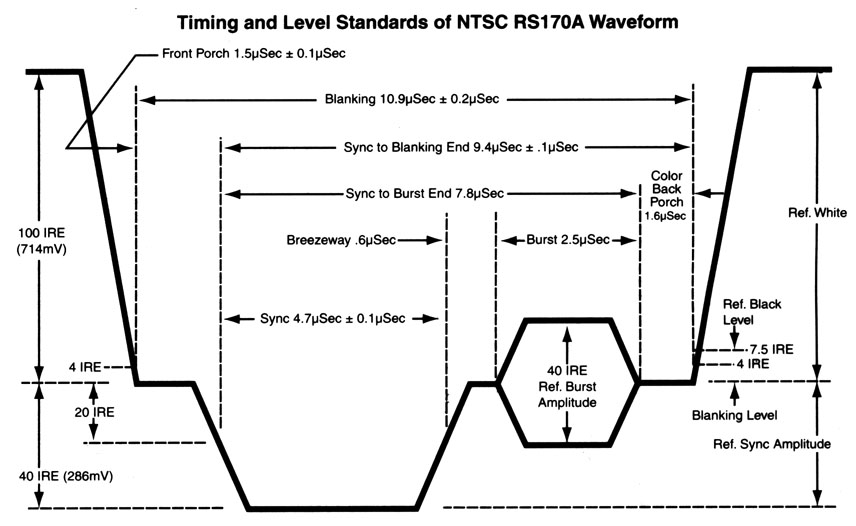
The color video signal standard used in the USA is called RS170A. The nominal baseband composite video signal has an amplitude of 1.0 Vpp. Video levels are conventionally measured in IRE units, where zero IRE (0 mV) is defined as the "blanking level" (see illustration above). The sync pulse extends to -40 IRE (-286 mV), and full white goes to +100 IRE (+714 mV). Knowing that 1.0 V = 140 IRE, and thus 1 IRE = (1/140) = 7.143 mV lets us use a normal oscilloscope as a waveform monitor.
The NTSC video signal shows a full frame in 1/30 sec (actually 1/29.97 seconds or 33.367 msec). The frame is divided into two fields, which contain respectively 262.5 even and 262.5 odd scanlines. (Half a scanline? In field 1, the raster runs off the bottom of the screen halfway across, and in field 2, it enters at midpoint.) The even scanlines are transmitted in one field, and the odd scanlines in the next field. Since the full frame is made up of the interlaced scanlines from each field, the system is referred to as interlaced video. Each scan line takes 63.56 us so the horizontal retrace frequency is 15.734 kHz. The horizontal blanking interval (front porch, sync, colorburst, back porch) is 10.9 us, so there is 52.7 us for the image portion of the scanline. Sampling at 13.5 MHz would resolve the active image region into 711 pixels. (Not all of the scanlines include image information, as the vertical sync pulse and equalizing pulses take up about 18 lines out of each field. The DV standard only encodes 480 active scanlines of image data.)
In the image portion after the blanking interval, the level of the video signal is proportional to image brightness, and should fall into the range of 7.5 IRE (black) to 100 IRE (full white). Tektronix's web site has some useful information about video measurements if you need more details.
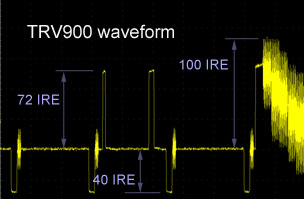
I do not have a waveform monitor or a vectorscope, but I do have a regular oscilloscope. The measurements below were made with a Tektronix TDS210 digital scope (60 MHz bandwidth, 1 GHz sample rate) connected to the composite output of the TRV900, with a 75 ohm load at the scope end. The data from the scope was uploaded directly to my PC, I didn't photograph the screen.
My measurements indicate that the TRV900 composite output is very close to
the nominal video standard signal, as you would expect. The first image
shows the white references pulses just before the start of a field. The
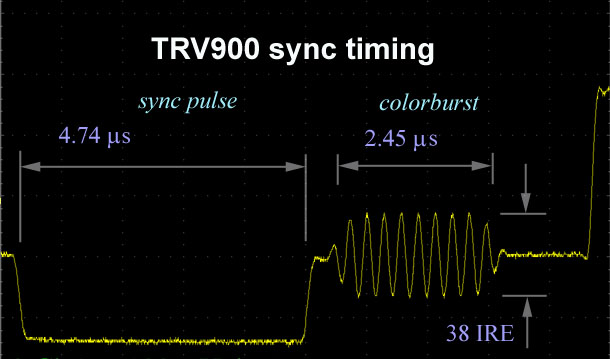
measured amplitudes are as indicated. The second image shows the sync pulse
and color burst signal before the start of a scan line.
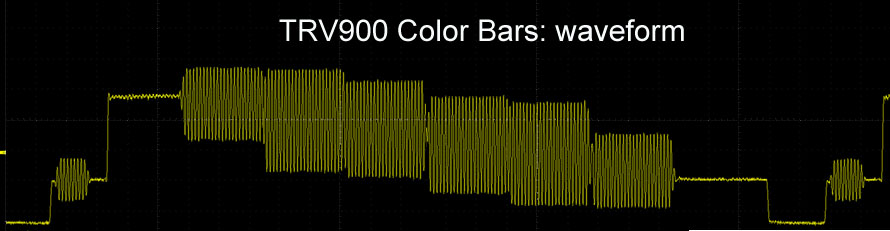
Here is a picture of the internally-generated color bars, which matches the
standard NTSC color bar pattern very well.
The NTSC standard specifies that the black level ("setup") is different from the blanking level. Specifically, blanking is 0 IRE and setup is 7.5 IRE. Apparently many Japanese video cameras use a setup of 0 IRE. Looking at the video signal with the shutter closed and the lens cap on, I measure my TRV to have a non-zero, but very small setup: about 3.6 IRE.

Dynamic range: I wanted to see what range of intensity the camera could measure. I arranged a test target with a uniformly lit diffuser and a ND filter in the middle which cut down the light by approximately 1.75 stops (transmitted light reduced by 70%). Based on readings with my 35mm camera light meter (accurate only to 0.5 stop or 25%) I measured the brightness of the two areas on my test target to be EV 10 (same as 5500 lux on 18% grey target) and EV8 (1400 lux on 18% grey). I then measured the output waveform IRE level in the two regions at various f-stop apertures on the TRV900 (using normal 1/60 sec interlaced scan, 0 dB gain). At f/2.8 the zebra stripes (100 IRE) were just starting to cover the brighter target area. My results are shown in the table below. I observe that the ratio in IRE readings between dark and light areas is near 2:1 at all ranges, but is greatest at the f/4 setting.
| f-stop | EV 10 | EV 8 |
| f/11 | 18.4 IRE | 9.6 IRE |
| f/8 | 27 | 14 |
| f/5.6 | 46 | 21 |
| f/4 | 70 | 31 |
| f/2.8 | 95 | 51 |
Based on these measurements, I conclude that the range in intensity between 9.6 IRE and 95 IRE is almost 6 f-stops, or a contrast ratio of about 50:1.
I have measured the DV Transfer Curve from digital pixel values to analog output levels for the TRV900 and TR7000 cameras, and also the light transfer curve.
   Audio Input Levels
 for TRV900 and TR7000
 with 440 Hz sine wave

Mic Input      Line Output
--------------------------
100 uV (RMS)   73 mV (RMS)
500 uV        350 mV
720 uV        515 mV
925 uV        595 mV
1.2 mV        630 mV
2.3 mV        700 mV
6.2 mV        753 mV
 20 mV        800 mV
 40 mV        853 mV
-------------------------
42 mV     starts clipping

no input noise level: 2 mVrms at line output
which is equivalent to 3 uV at mic input
Line In	 Line Out  (both mVrms)
-----------------------------
<0.5	<0.8   (noise level)
54.6	55.0
198	209
495	525
1000	770
4040	791
8000	814
-------------------
In manual audio level mode, ratio of mic input level to A/V monitor output is linear right up to clipping. You can look at the audio level on the LCD screen (in manual audio level mode) and determine audio level quantitatively. There are 18 white bars and 2 red bars on the level meter. They cover a range of about 30 dB. Specifically, they mark the following levels: ( 0 dBu = 0 dBmW on 600 ohm systems = 0.775 Vrms)
Audio level meter         Vrms on      level
bars on screen           A/V output    in dBu
---------------------------------------------------------
barely 1                     27 mV     -29 dBu
2                            36 mV     -27
5                            63 mV     -22
8                           105 mV     -17
13                          271 mV     -9
18                          614 mV     -2.0
19                          747 mV     -0.3
20                          842 mV     +0.7
clipping                   1013 mV     +2.3 dBu
----------------------------------------------------------
The level measurements were done using a 1 kHz sine wave input to both L and R channels (through XLR-Pro adaptor in mono mode), and a digital scope to measure output levels from the A/V jack.
  Audio tone (6 seconds)
  Audio tone (30 msec)
  Tone spectrum
  Noise spectrum
It looks to me like the "tone" recorded at about -12 dBfs (the fourier transform was taken over several seconds of data, so the level fluctuations are averaged). The average signal power is -12.0 dB (Left) and -8.3 dB (Right) RMS.
The "silence" looks to have most energy at 60 Hz (-64 dB) and 120 Hz (-72 dB), and a -78 dB at the 15.7 kHz horizontal retrace frequency. Total average noise power is -58.2 dB (Left) and -57.8 dB (right) average RMS power, dominated by the 60 Hz frequency. After applying a filter to notch out 60 and 120 Hz from the noise, I got -60 dB average total power. If broadband noise is at -60 dB and your average peaks are at -12 dB, you have a 48 dB SNR. By contrast, I measured my Sharp MD-MS702 MD recorder to have 81 dB SNR (or 69 dB if you want 12 dB headroom), using line-in and headphone playback (notes here).
If you want to measure noise the way your ear hears it, you need a weighting filter. The ear is much less sensitive to low and very high frequencies. For those interested, here is the shape of the "A" weighting filter, used to approximate the response of a supposed standard human hearing. I made this table based on the equation at msaxon.com. Relative to the response at 1.0 kHz, this weighting curve is down by 33 dB at 50 Hz, down 10 dB at 20 kHz and enhanced 1.4 dB at 2 kHz.
  A-weighting filter
----------------------
  20 Hz  =  -52.6 dB
  50 Hz  =  -32.6 dB
 100 Hz  =  -20.8 dB
 200 Hz  =  -11.7 dB
 500 Hz  =  -3.56 dB
1000 Hz  =   0.0  dB
2000 Hz  =  +1.41 dB
5000 Hz  =   0.0  dB
10000 Hz  =  -3.74 dB
15000 Hz  =  -7.02 dB
20000 Hz  =  -9.83 dB